There is a current perception that the F1 grid is going through a purple patch. The relatively old hands of Alonso, Hamilton and Vettel are still putting in strong performances, whilst there also seems to be a glut of young and talented drivers too. Here we investigate whether the current F1 grid is strong compared to those of the past, and whether it is something unique to the current line-up or part of an ongoing trend.
The main piece of evidence used is the yearly performance scores for drivers. These are obtained from the mathematical model, and are used to rank driver’s performances every year. Here we have plotted the scores of the best performance each year since 2000, along with the 5th best performance and the 10th best performance.
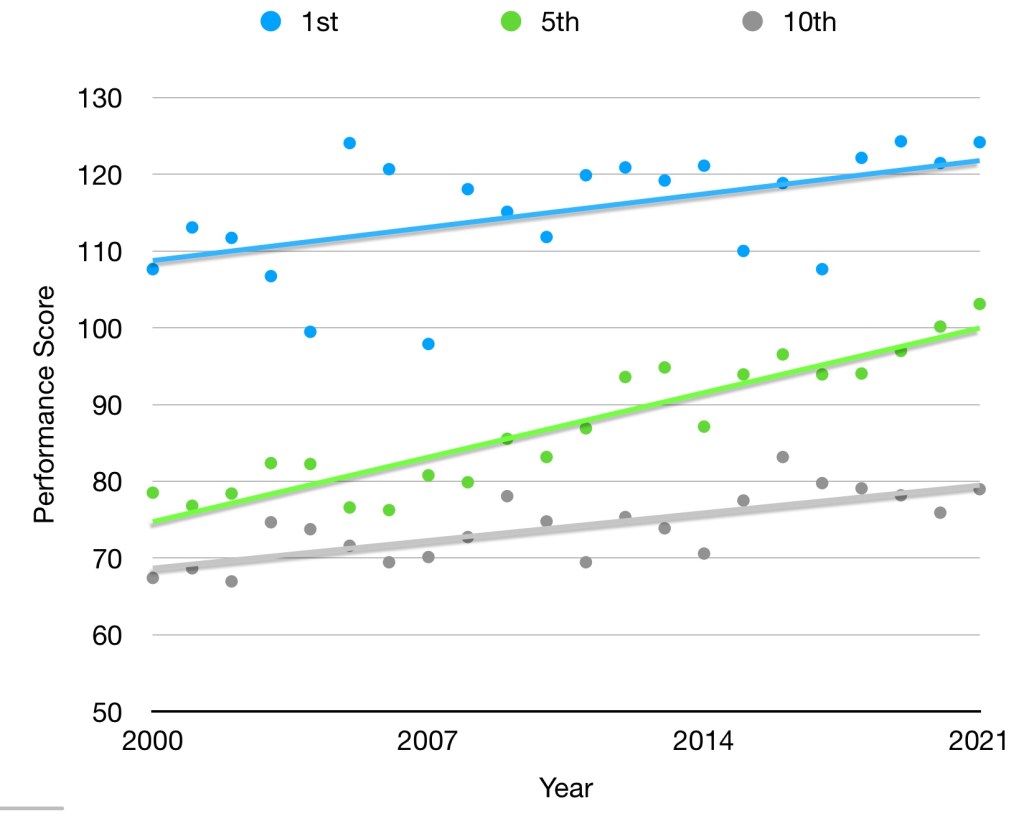
Obviously all 3 lines are trending upwards. The best performing driver is much more volatile than the other rankings. This is because there are only ever a few drivers capable of a top performance, so a top driver having a poor performance will cause a big drop. There is some evidence that the top performances are increasing over time, however, the correlation is rather weak. In actual fact, there is little evidence that the top performing driver is getting better over tim(if you go back further, the top rated driver of the past 40 years is Prost).
The 5th best performing driver shows the most significant increase over time, as well as the highest correlation for linear growth (R squared = 0.86). This is the most likely explanation for to explain why the top performance average is increasing too: when the highest rated driver underperforms in a given year, the gap between him and the rest of the field is smaller, so the top performance rating doesn’t suffer as much as previously.
The 10th best performer is increasing at a slower rate, with a worse correlation assuming linear growth (R squared = 0.56), but the trend is still clearly there. The 10th best driver today is expected to perform equal to the 5th best performer 15 years ago. An example of this is Sebastian Vettel’s career. Several people have expressed surprise that the model does not rank them higher overall. This is mainly due to the model thinking that they drove very strong cars and/or had relatively weak teammates in some of their strongest years (both Webber and Räikkonen are rated as decent, but not exceptional, drivers.) However, the power creep in F1 has also taken its toll. In the Vettel career review, we noted that Seb took a while to reach his achieve his top performances. However, his 2008 season is still ranked as the 3rd best that year. The same ranking would only be good enough for 7th in 2021.
The results here suggest that this is a general trend rather than an exception. One obvious missing piece of information here is the lower half of the grid. This has not been compared here for a few reasons. Firstly, lower ranked drivers are typically in F1 for fewer years, meaning the model isn’t as robust at assessing their exact potential. Secondly, the grid is smaller now than at other points, so there is less scope for lower ranked drivers to get into the sport in the first place. Lastly, in a similar vein to the best performer, the worst performing driver is quite volatile, and the score can vary from respectable to embarrassing. This is definitely something that could be investigated further, however.
Why are F1 drivers getting better?
Whilst the model doesn’t state give any direct answers to this question, it is worth pondering whether the effect is actually real or a consequence of the model used. To find a yearly score, the model takes the expected score (derived from each teammate’s career) and gives a predicted score. The scores for both teammates are then adjusted to reflect the reality. However, the adjustment is not even, with the model assuming that a driver is more likely to underperform than over perform their expected level. (This is one of the few inputs that is relatively arbitrarily chosen, although it seems to fit with conventional wisdom.)
This means that average scores for a season will be higher if drivers are performing at their expected level. Considering that both a small sample of races and unreliability are both causes of poor predictions, it is possible that the predictions made by the model are getting better over the years due to the increased season length and improved reliability. To investigate this, we plotted the median and mean error levels of predictions across each season (for any driver pairing of at least 40% of the season) to see how they changed with time.
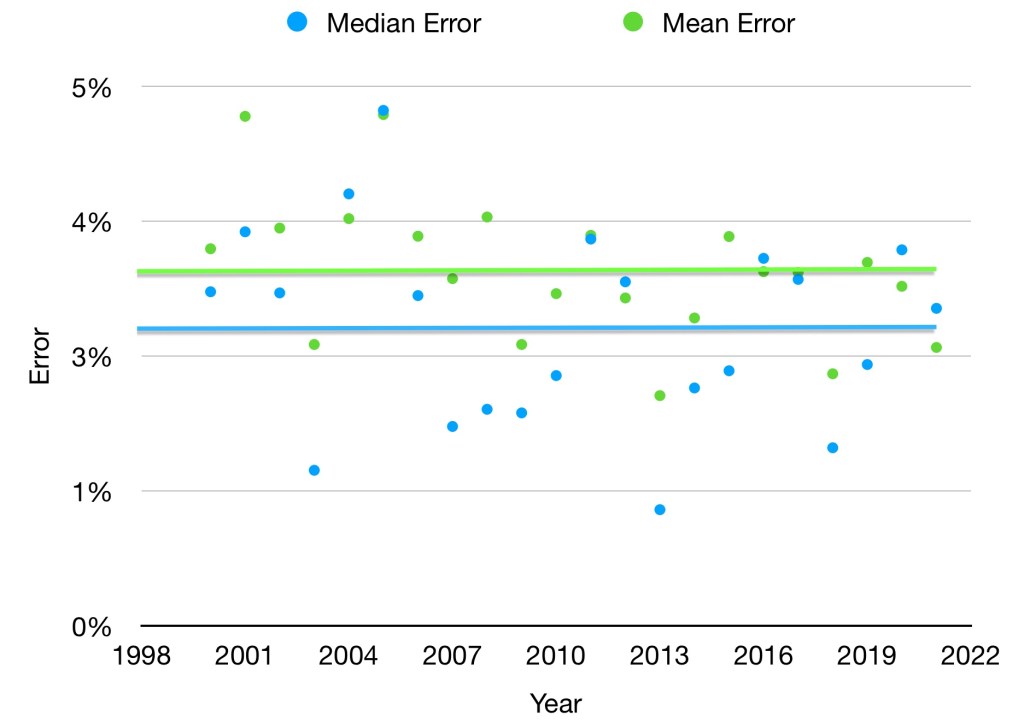
Whilst there is plenty of year to year variation in the errors, the overall trends are clearly flat, suggesting that this cannot be the reason for the performances improving over time. (Note: the specifics of what this graph are showing is not obvious. It is comparing the expected result if the teammates were in a dominant car, with an error based on real data but also calibrated to the same car performance.)
We can only speculate as to what is the cause of the increase. Another thing that it cannot be is the increase in technology or data (e.g. better simulations) because every driver will have access to these in a given year. However, it may be that younger drivers are more adept at using more modern data and technology techniques. Another reasonable explanation is that the sport as a whole has become more professional over time. For example, the idea of academy drivers is well established in F1 now, but is a surprisingly modern concept (Ferrari’s first Academy Driver was Jules Bianchi, for example).
Is the 2021 F1 grid the best ever?
Comparing to 2020, we can see that the grid is relatively stable, with the only driver changes being the arrival of Tsunoda, Alonso, Schumacher and Mazepin in place of Albon, Kvyat, Grosjean and Magnussen. Out of these drivers, Tsunoda is seen as a downgrade on both Albon/Kvyat, whereas Alonso is seen as an upgrade despite his age and a return to the grid. The model doesn’t have any assessment on Mazepin/Schumacher yet, given that they have only faced each other, but the general perception is that Grosjean and Magnussen would have been a stronger pairing than the 2 rookie drivers. Whilst this makes it look like the 2020 grid was at least as strong, the model expects many drivers to be stronger in 2021 than previously due to increased experience (Norris, Latifi, Russell, Ocon and Giovanazzi fall under this to varying degrees). On the other hand, Räikkönen’s default expectations were slightly lower this year due to age related decline.
The average performance scores for 2021 (so far) vs 2020 are almost identical. Discounting the Haas drivers, the mean performance score for both years is 83% (i.e. drivers on average would be expected to score 83% of Hamilton’s points in a championship winning car). However, the 1st, 5th and 10th best performing driver are rated higher in 2021 than previously. The 5th best performer is currently at its highest level ever, and 1st and 10th are not too far off their peaks either. Whether this is the best year ever in terms of performances is up for debate, but it is certainly considered to be an exceptional one, even if it is broadly in line with expectations.
Thanks for reading.
Please subscribe for more great content!

Pingback: Home Page – F1 Analysis
Pingback: Finishing Position of the GOATs Part 2 – F1 Analysis
Pingback: 2021 F1 Mathematical Driver Rankings – F1 Analysis
Pingback: A History of F1: Who is the GOAT? – F1 Analysis
Pingback: How good is Fernando Alonso? – F1 Analysis
Pingback: The Fastest F1 Driver, Mathematical Analysis, F1-Analysis.com
Pingback: F1 Mathematical 2023 Driver Rankings - F1 Analysis
Pingback: Who's The Greatest F1 Driver Of Each Era? - F1 Analysis