Previously I have looked at the finishing positions of the greatest and most successful drivers in history (see Part 1 and Part 2). Here I have combined the two articles, as well as updated the stats to the end of 2022. Every driver who’s ever won multiple world championships or at least 20GP is included.
Each driver’s career is displayed as 2 pie charts, one chart including DNFs/other (”other” includes disqualifications, non-starts and withdrawals) and a 2nd pie chart DNFs/other to show how greatly they influenced a driver’s stats. Points finishes are from the time of the race (so a 9th place finish would count today, but wouldn’t for most of F1 history). For the graphs a classification counts as a finish, but any reference in the text to reaching the chequered flag means that they actually crossed the finish line.
Enjoy!
- 1950s (Fangio, Ascari, Brabham)
- 1960s (Clark, Hill, Stewart)
- 1970s (Fittipaldi, Lauda)
- 1980s (Piquet, Prost, Senna)
- 1990s (Mansell, Hill, Häkkinen, Schumacher)
- 2000s (Räikkönen, Alonso)
- 2010s/2020s (Rosberg, Hamilton, Vettel, Verstappen)
- Conclusions
Drivers are ordered from when they first won the world championship.
1950s (Fangio, Ascari, Brabham)
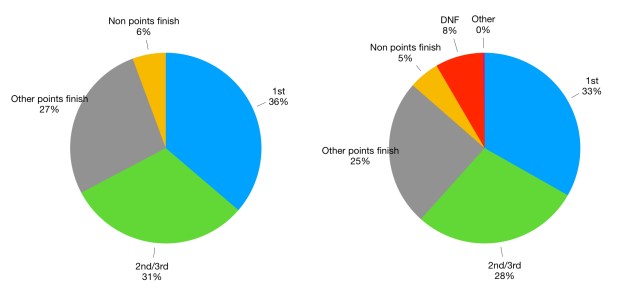
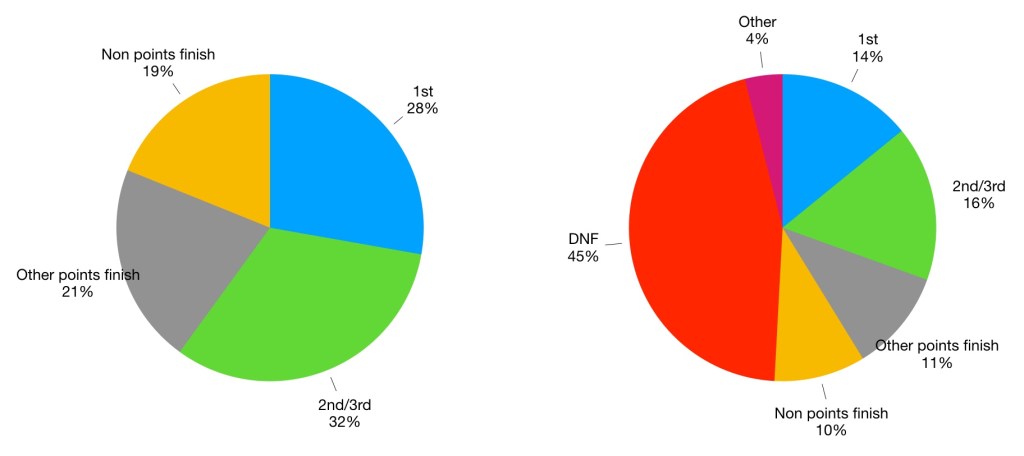
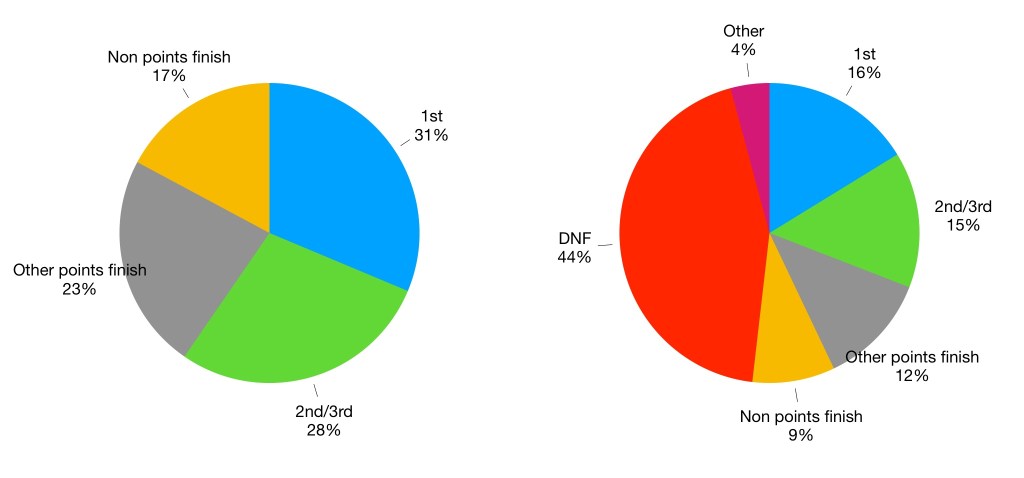
Juan Manuel Fangio (52 entries)
Fangio’s career stats are truly astounding. Whilst his short career (just 51 starts) means that most of his absolute records from the era have been smashed many times over, he still holds several percentage records that are unlikely to be beaten. These include highest percentage of wins (46%) and highest percentage of front row starts (92%). He’s also the only driver to have won championships with 4 different teams.
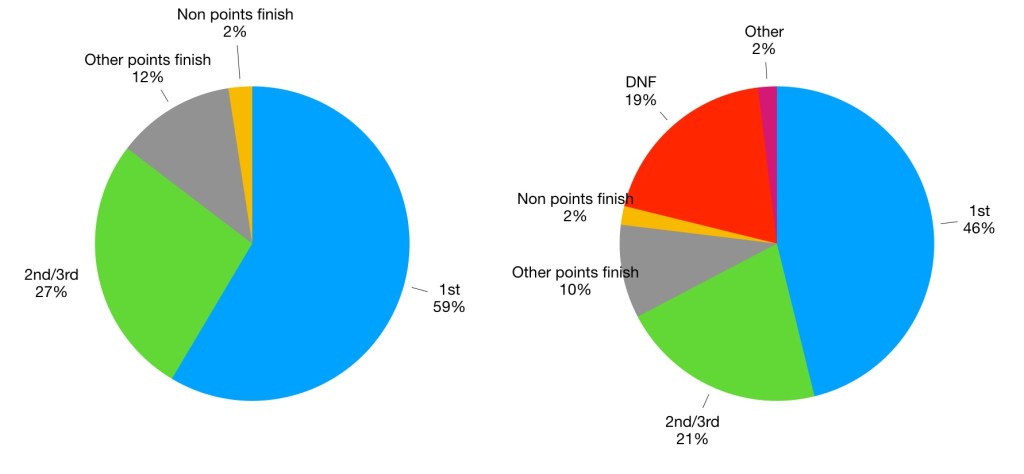
Alberto Ascari (33 entries)
Ascari’s percentage records are similar to that of Fangio’s, with the caveat that he only entered 33 championship races. His record of 9 consecutive victories (not including the Indy 500) has never been bettered, and his 13 victories were all achieved within a span of 16 race starts. Whilst this is sometimes attributed to the dominant Ferrari car of 1952-1953, he was never seriously troubled by any teammate. His run of success was followed by 7 straight retirements (although he did record 2 fastest laps in this period) before an untimely death whilst testing for Ferrari at Monza.
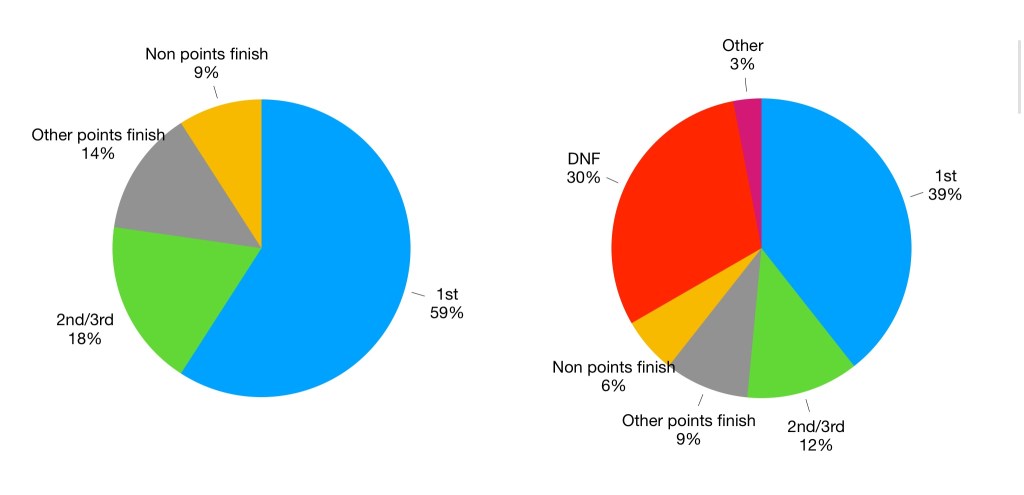
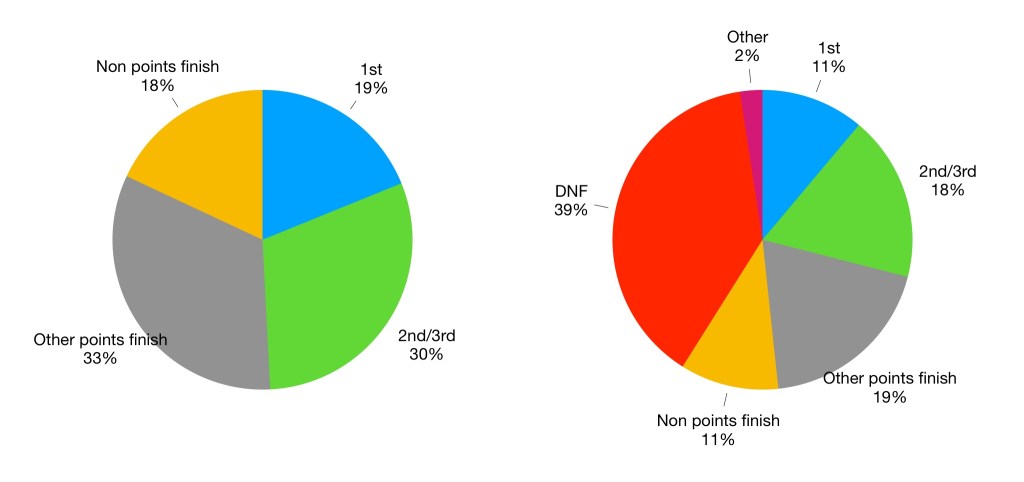
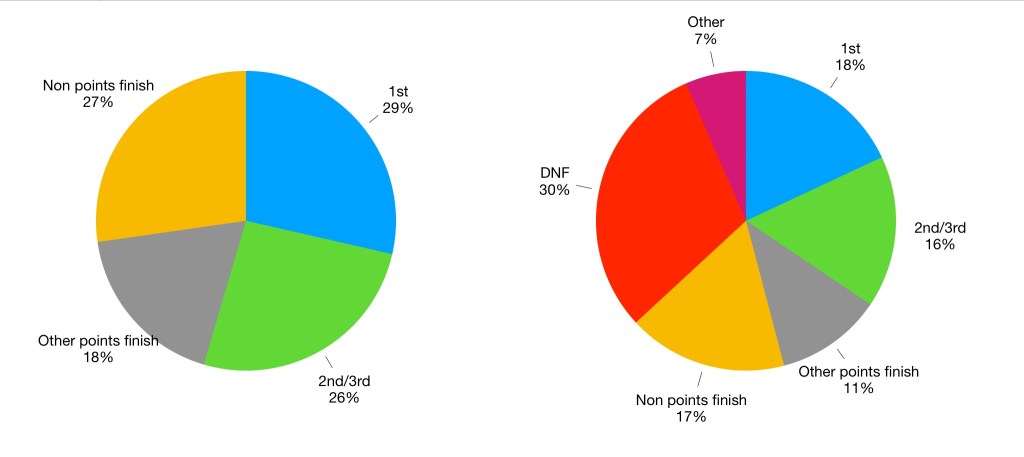
Jack Brabham (128 entries)
Brabham’s claim to F1 greatness is clear. He was only the 2nd driver to win 3 or more titles, and one of only a handful to win championships with more than 1 team. Arguably his greatest F1 triumph was winning with his own team (Brabham). It took him a full 5 years to win a race with Brabham, which partially explain why his win rate is relatively low for a 1950s/60s driver. His high DNF rate is also due to his last 3 years in the sport: in his last 33 races he finished just 13 times.
1960s (Clark, Hill, Stewart)
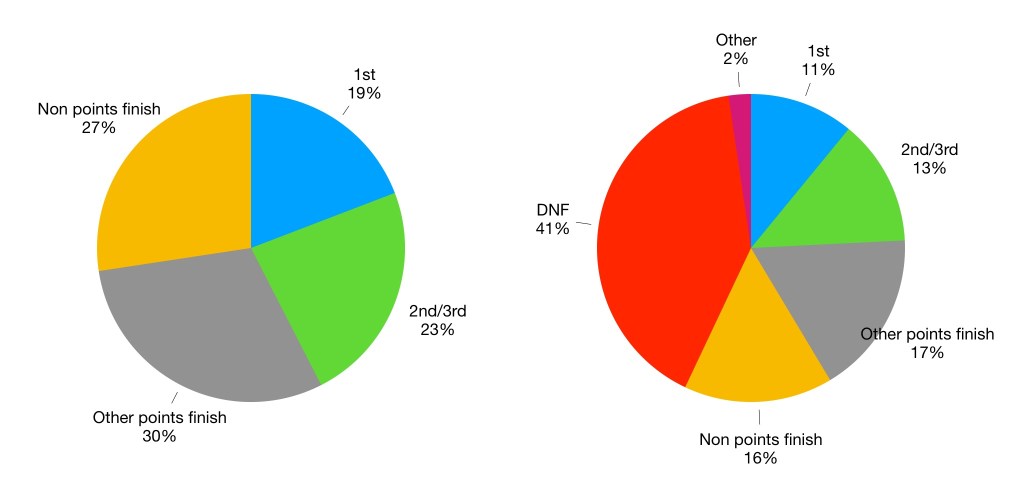
Jim Clark (73 entries)
Clark‘s percentage starts are second only to Fangio’s. He has 25 wins but only 1 second place, reflecting his lack of competition in competitive cars. He DNF’d in approximately 1/3 of races, a significantly worse rate than Fangio but better than most drivers up until the late 1980s .
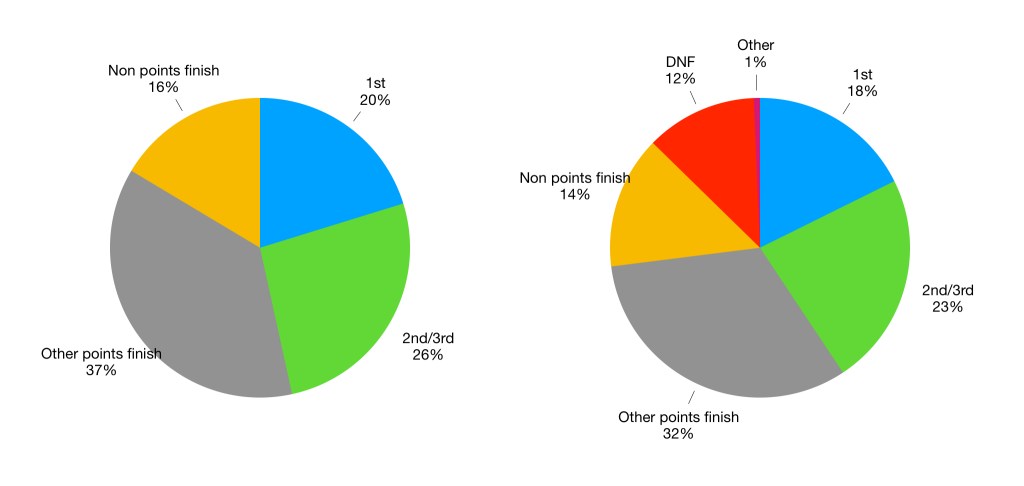
Graham Hill (179 entries)
As with Brabham, Hill’s stats are notable for a high DNF rate and a low win rate considering he was a multiple world champion in the 1960s. Hill failed to finish his first 7 F1 championship races, and also took a while to get a competitive package. However, along with his 2 championships, Hill was a the championship runner up 3 times, showing that his success was not limited to just a couple of seasons. (He actually outscored champion Surtees in 1964, but lost the title due to not all races counting towards the championship). The very high rate of non-points finishes is largely caused by the end of his career. In his last 3 years he finished 21 races, but only managed a single point. This career arc is not unusual, with Vettel and Räikkönen being recent examples of drivers that failed to achieve success at the tail ends of their career.
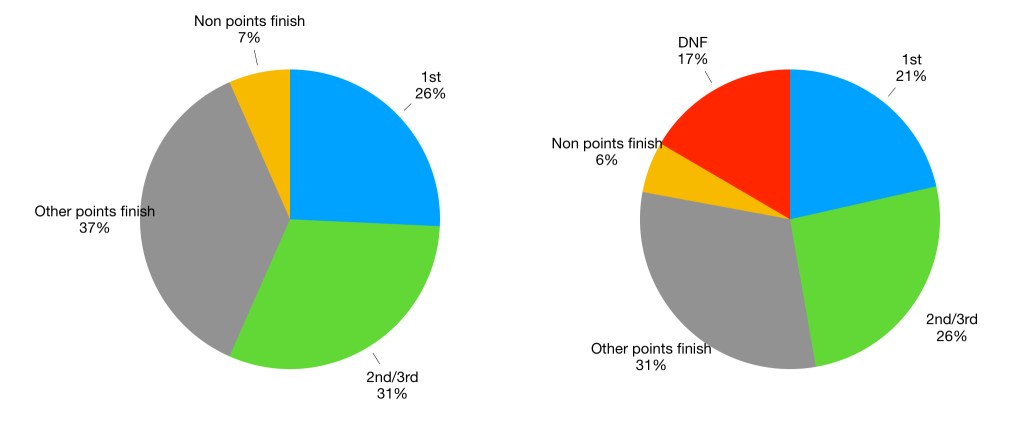
Jackie Stewart (100 entries)
Whilst Stewart is rightly given much praise for his campaigns to improve safety within the sport, he is frequently not given enough credit for his performances as a driver. His record of 27 victories stood for 14 years and he won 43% of the races he finished- a feat that no driver since has matched.
1970s (Fittipaldi, Lauda)
Emerson Fittipaldi (149 entries)
Fittipaldi’s successes in F1 were highly concentrated between 1972 and 1975. During. this period he won 2 world championships and 13 races. In his 7 other years in F1 there was just a single victory and a further 5 podiums. Most of this was self-inflicted, as he left title winners McLaren after 1975 to set up his own racing team, in a similar vein to Brabham before him. The Fittipaldi racing team was the only constructor ever to be based in Brazil. However, it achieved barely any success, even with such a high profile driver at the wheel.
Niki Lauda (177 entries)
Lauda has a higher DNF rate than any other driver on this list, with his 1980s comeback being particularly bad. He failed to finish 6 of the first 9 races in his championship winning 1984 season, and reliability the following year was even worse! Even accounting for reliability his win rate is one of the lowest here, although of course it’s still exceptional compared to almost any other F1 driver.
1980s (Piquet, Prost, Senna)
Nelson Piquet (207 entries)
Piquet’s Brabham years were littered with unreliability, but still yielded 2 titles. For his final championship with Williams, he won only half the races of teammate Mansell, but made up the difference with several more podiums. Piquet’s wins are remarkably spread out over 10 seasons, and he only won 3 races in each of his championship years. He is the only triple world champion not to dominate in at least 1 of his championship years, instead being consistently near the front for an extended period of time.
Alain Prost (202 entries)
Prost was on the podium in 3/4 of all races he finished, second only to Fangio on this list. There is also some evidence that he was almost uniquely able to drive in a style to reduce mechanical DNFs. He held the record for most wins for the best part of two decades before Michael Schumacher’s successes at Ferrari overhauled it.
Aryton Senna (162 entries)
Senna’s record is almost identical to that of his rival Prost. It’s tempting to explain the subtle differences in their stats in terms of their differing mentalities. Senna was slightly more likely to win a race he finished, but is hurt by slightly higher DNFs. However, truth is that the differences are just splitting hairs. Like Clark, Senna’s career was tragically cut short, but there’s no evidence in either case to suggest their percentage win rates would have suffered in they’d been able to continue racing for a few more years.
1990s (Mansell, Hill, Häkkinen, Schumacher)
Nigel Mansell (191 entries)
Whilst Prost and Senna have near identical percentage stats, Mansell and Piquet also had similar stats for most of the 1980s. Only a flurry of success in the early 1990s pulled Mansell’s win rate clear. Mansell’s DNF rate is unusually high for a driver with such a long and accomplished career. Unusually this is not caused by a particular year or stint in a poor package. In every season he raced in F1 he retired from at least 25% of the races he competed in, with over half of the seasons featuring retirements in at least 50%. Between the 1987 Japanese GP and the 1991 Sam Marino GP, he reached the chequered flag just 15 times in 49 races, despite being a top driver in 2 of the top 3 teams of the era (Williams and Ferrari).
Damon Hill (122 entries)
Damon Hill is often overlooked in discussions of the greatest ever F1 drivers. Hill spent over half is career at Williams, and during that period the team won the constructors title 3 times. He also faced Prost, Senna and Mansell as teammates during this period, meaning he was directly compared to some of the very best (albeit all had mitigating circumstances as to why they were not at their peak). Hill’s record at Williams is actually pretty exceptional: he won 85% of the races he finished! However. he was involved in more self-inflicted DNFs during that period than one would expect for an absolute top line driver. His post Williams career featured some giant killing performances, but was rather spotty overall.
Mika Häkkinen (165 entries)
Despite spending the vast majority of his career with McLaren, Häkkinen spent several years in the midfield due to the team going through a dry patch. His first 2 victories were also controversial, as teammate Coulthard let him through both times. However, his win rate after his first win was relatively strong (20/66). Only once during that period was he classified outside of the points: the 2001 Spanish Grand Prix. In it he led by well over half a minute before engine issues on the final lap.
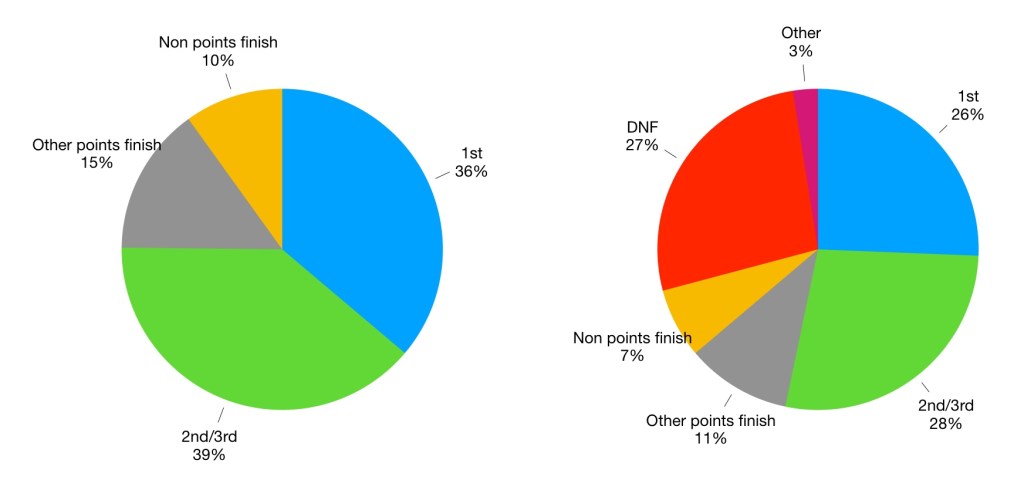
Michael Schumacher (308 entries)
Given that we’re looking at percentages, Schumacher’s number are obviously hurt by his Mercedes comeback. His win rate including DNFs falls from 36% to 30%, for example. As with Prost, Schumacher’s win total seemed almost insurmountable at the time it was set, only for it to be overhauled within a couple of decades.
2000s (Räikkönen, Alonso)
Kimi Räikkönen (351 entries)
Whilst Kimi was anything but an ordinary F1 driver, his career arc is actually pretty typical, with a rise, peak and fall. As the second most experienced driver ever (behind Alonso), it would be difficult to maintain high percentages of victories and podiums for so long, but he still managed 8 different seasons with a victory and 14 with at least a podium. His career closing stint with Alfa Romeo was by far his least successful, resulting in around 2/3rds of his non-points finishes.
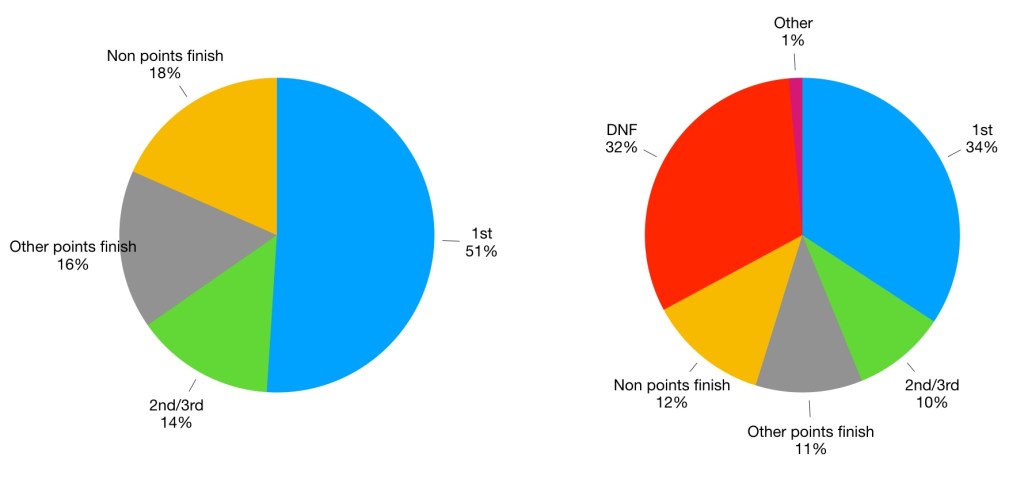
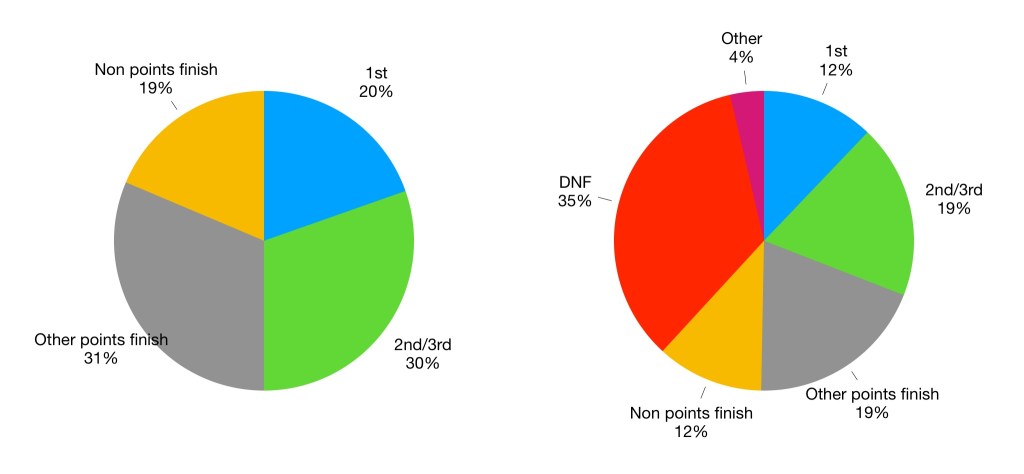
Fernando Alonso (328* entries)
*Correct as of the end of the 2022 season.
Alonso has the worst percentage stats of everyone here, winning just 9% of the races he entered. However, he still sits 6th in the all time winners list, emphasising how career and season lengths have changed across F1 history. He’s also the only driver with significantly more 2nd/3rd places than victories. This is partly due to his cars not quite being good enough, but it also appears to be a trait of Alonso himself: One of the main reasons neither Räikkönen or Schumacher caught Alonso in his championship winning years was his efficient podium gathering, particularly when the car was not the absolute fastest.
2010s/2020s (Rosberg, Hamilton, Vettel, Verstappen)
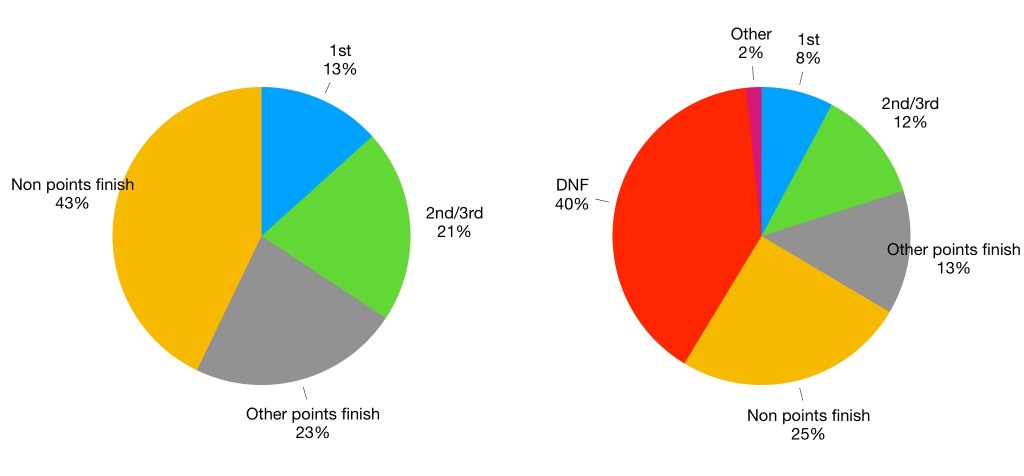
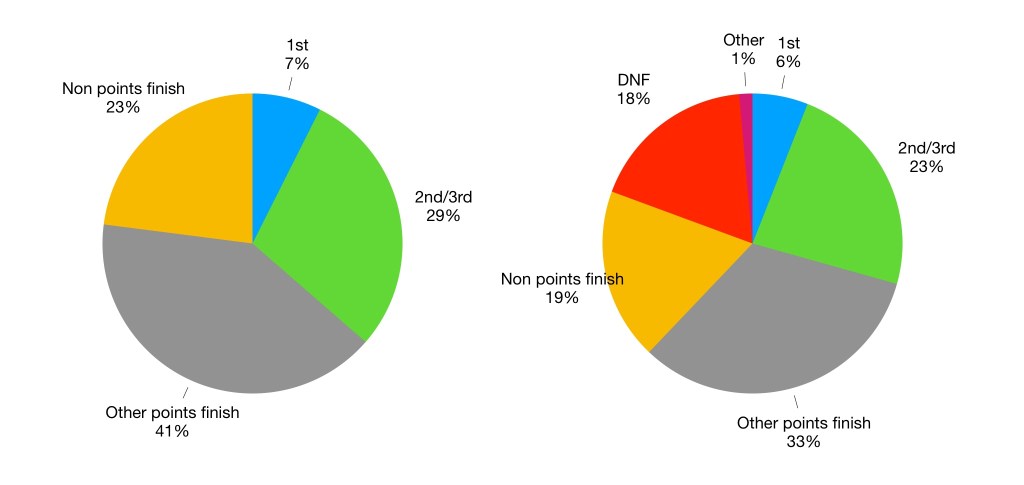
Nico Rosberg (206 entries)
Like Häkkinen, Rosberg took his time winning his first race before landing himself in a competitive car that allowed him to win the championship. His DNF rate is typical for the era in which he raced, but Nico does have the distinction of being the only driver here without a single DSQ, DNS or DNQ in his F1 career. Whether this is down to the driver, the racing era or pure luck is up for debate, but it’s probably a combination of factors.
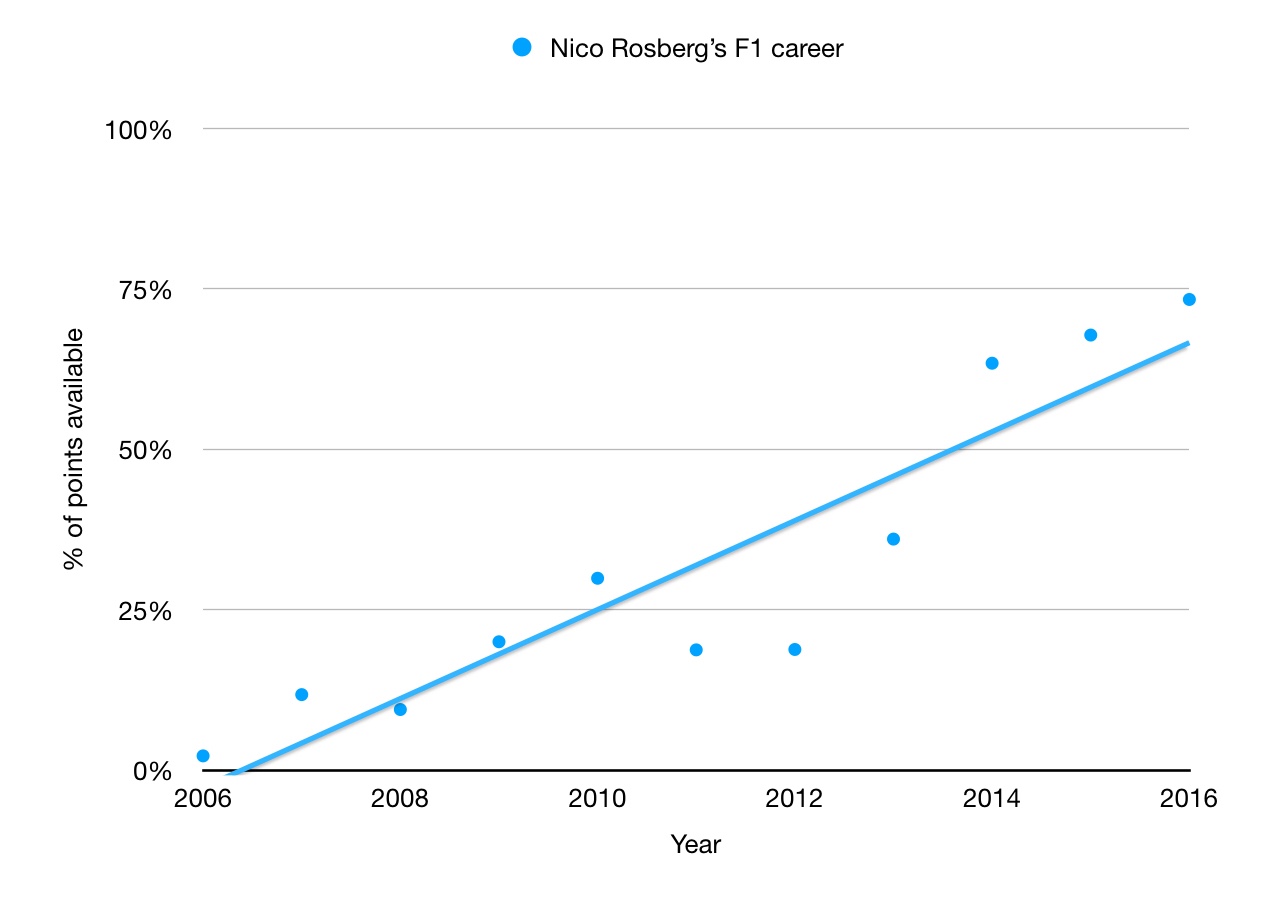
As discussed in Rosberg’s career review, Nico produced better and better results almost every year in F1. He went 6 full seasons without winning a race (including 2 seasons with Mercedes), before finally winning one in 2012. In the next years he won 2, 5, 6 and finally 9 races in his championship year in 2016.
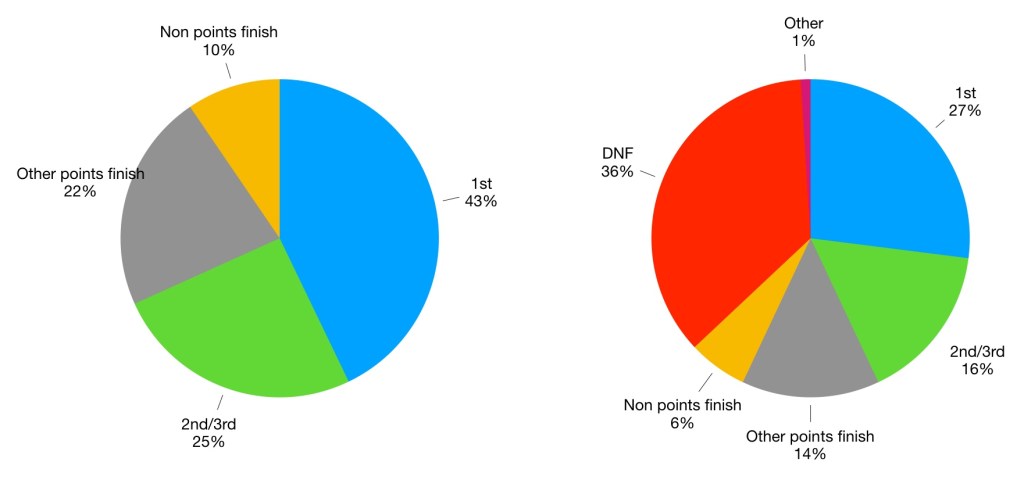
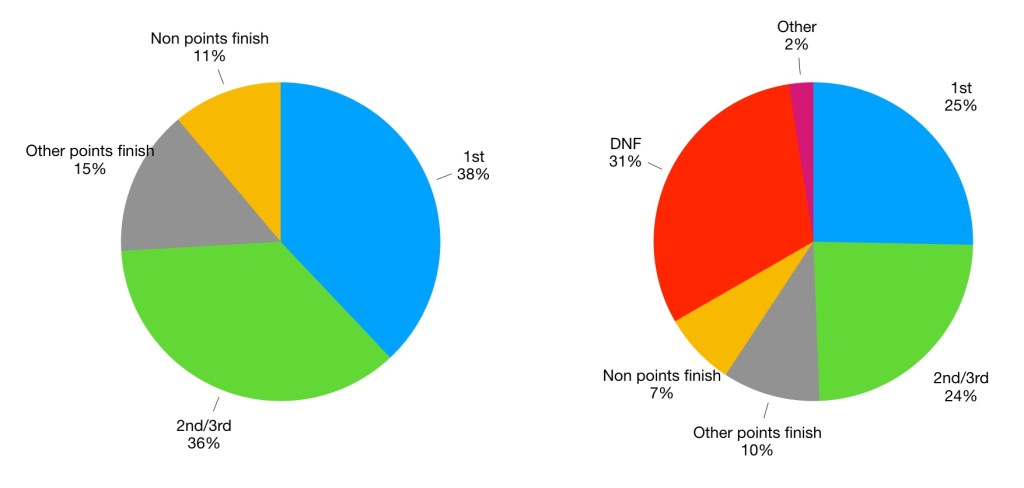
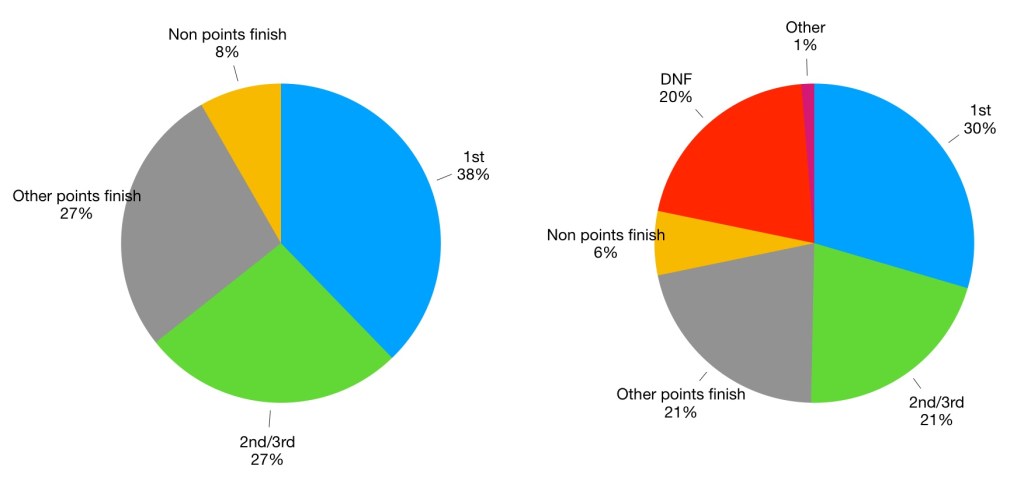
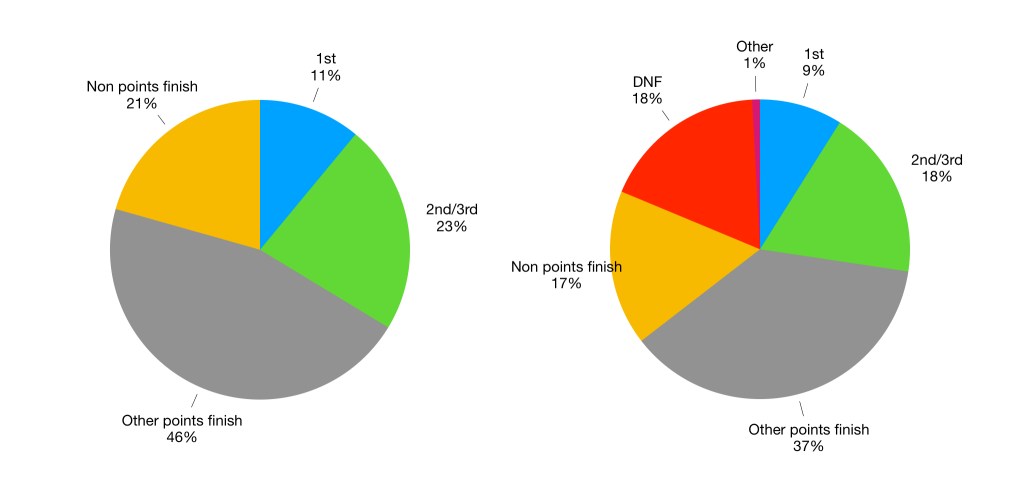
Lewis Hamilton (310* entries)
*Correct as of the end of the 2022 season.

Hamilton has so far won 36% of races he’s finished. It is worth mentioning that percentages for Prost, Senna and Schumacher are all extremely similar (36%-38%). Of course Hamilton is in the discussion for who is the greatest driver of all time, but the stats don’t automatically place him above others in this list. However, including DNFs Hamilton has a higher win rate than all of others bar Fangio. This is even more impressive considering the different eras and circumstances.
Whilst the lack of a win in 2022 has lowered his winning percentage a little, it is still extremely high, and compared to the careers of Räikkönen, Alonso, and Vettel, a single season without a win is not a long period of time.
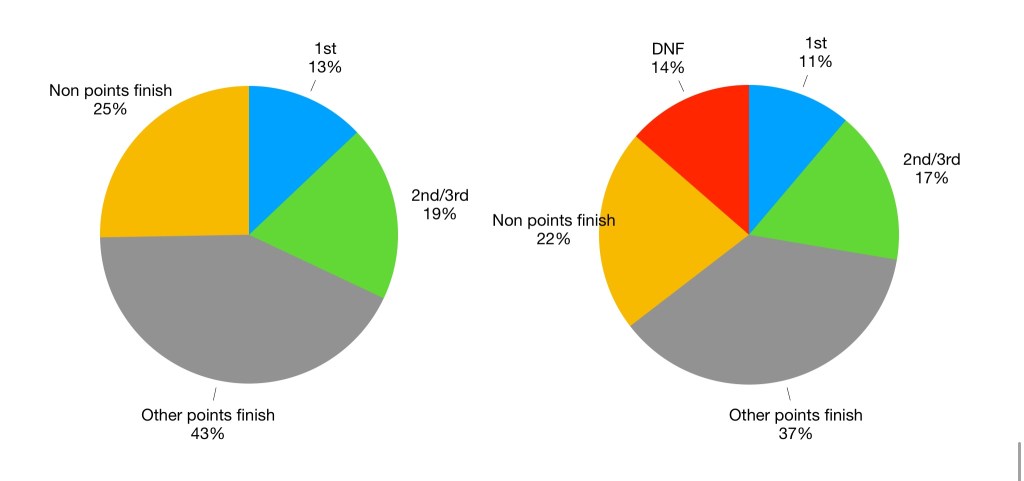
Sebastian Vettel 300 entries
For such a successful driver, Vettel’s win rate is surprisingly low. It also appears that modern F1 makes it difficult for 2 drivers with significantly overlapping careers to have high percentage win rates across their career. Although Mercedes domination is of course a factor, Nico Rosberg’s win rate is less than half of Vettel’s and below even Alonso’s. As with Lauda, Vettel’s win rate is exceptional, just not quite as impressive as others on this list.
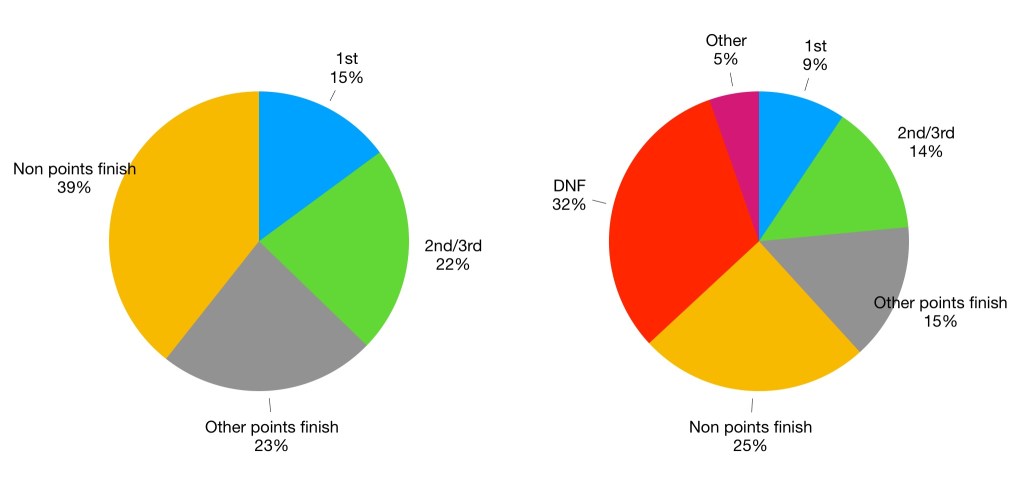
Max Verstappen 163* entries
*Correct as of the end of the 2022 season.
Relative to Hamilton or Alonso, Verstappen’s percentages are much more volatile because he’s started in far fewer races. Recently his career has been going from strength to strength, and his win rate of 21% is a massive jump from the 8% it was at the start of the 2021 season. One might naturally expect these numbers to climb further, but of course this is somewhat dependent on how well Red Bull perform in the coming years.
Verstappen only has 6% of his finishes outside the points. This is lower than every other driver on this list bar Hamilton and Fangio. This is partly due to the fact that Verstappen is the only one driver here whose entire career is based on the modern points system (with points down to 10th place).
Conclusions
Top drivers in the 1950s and 1960s had shorter careers (often due to fatalities) with fewer wins, but a much better chance of having a higher percentage of victories. This is particularly true when DNFs are factored in, although Brabham’s and Graham Hill’s relatively low numbers are a reminder that the car has always been a major factor.
DNFs are significantly lower for modern drivers than is typical in F1 history, but the idea that F1 cars have generally become more reliable over time appears to be an oversimplification: retirement rates for great drivers in the 1950s-1990s are broadly flat, with a significant decline only becoming apparent in the early 2000s.
